Identification de longs éléments régulateurs dans les génomes eucaryotes
19 avril 2021
Les longs éléments régulateurs (LRE), tels que les îlots CpG, les tracts polydA:dT ou les éléments riches en UA, jouent un rôle clef dans la régulation des gènes mais, contrairement aux sites de liaison conventionnels des facteurs de transcription, peu de méthodes ont été proposées pour les caractériser de manière formelle et automatique. L’équipe interdisciplinaire du CNRS, créée en Octobre 2014 et associant l’IGMM (INSB), le LIRMM (INS2I) et l’IMAG (INSMI) a développé une approche computationnelle nommée DExTER (Domain Exploration To Explain gene Regulation) dédiée à l’identification de LREs candidats. Cette méthode a été appliquée à l’analyse des génomes de P. falciparum et d’autres eucaryotes. Ces analyses montrent que tous les génomes testés contiennent plusieurs LRE conservées au cours de l’évolution, et que l’expression des gènes peut être prédite avec une précision surprenante sur la base de ces longues régions uniquement. La régulation par les LRE présente cependant des comportements très différents selon les espèces et les conditions.
Menichelli C., Guitard V., Martins R.F., Lèbre S., Lopez-Rubio JJ.*, Lecellier CH*, Bréhélin L.*. Identification of long regulatory elements in the genome of Plasmodium falciparum and other eukaryotes. PLoS Comput Biol. April 16, 2021
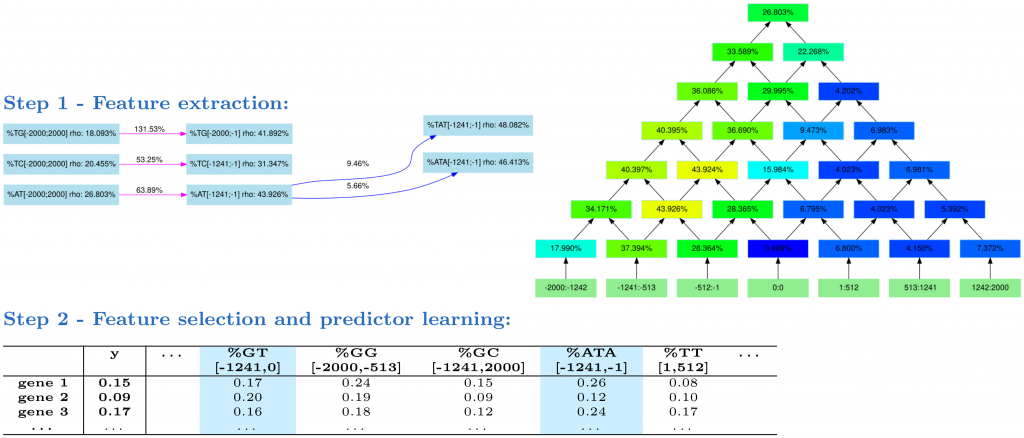
Fig 1. The DExTER method. In step 1, DExTER attempts to identify pairs of (k-mer,region) for which the frequency of the k-mer in the defined region is correlated with gene expression. DExTER starts with a 2-mer and compute a lattice (right) representing different regions. The top of the lattice represents the whole sequence, while lower nodes represent smaller regions. At each position, the correlation between 2-mer frequency and gene expression is computed, and regions with highest correlation are identified. For example, in the depicted lattice (which is the lattice associated with k-mer AT) the correlation between gene expression and AT frequency in region [-1241,-1] is 43.926%, while the correlation between expression and the AT frequency in region [513, 1241] is only 4.150%. Then, the 2-mer is extended to 3-mers, and the correlation with expression are computed in the best regions. If the correlation increases, the whole process is repeated with increasing k-mers. Otherwise, DExTER starts a new exploration from a different 2-mer, until every 2-mer has been explored. This way, different variables (i.e. pairs of (k-mers-regions)) are iteratively built (see an extract of the exploration graph on the left). In step 2, the frequency of all variables identified in step 1 are gathered into one long table. Then, a linear model predicting gene expression from a linear combination of the variables is learned. A special penalty function (LASSO) is used during training, for selecting only the best variables in the model (blue columns). If several gene expression data are available for one species (i.e. several y vectors), then step 1 is ran independently on each data, and all identified variables are gathered into a single table. Then, a linear model is learned for each data, but the different models are learned simultaneously with another penalty function that tends to select the same variables for the different data (group LASSO for multitask learning, see Materials and methods).
Nous utilisons des cookies pour vous garantir la meilleure expérience sur notre site web. Si vous continuez à utiliser ce site, nous supposerons que vous en êtes satisfait.