Identification of long regulatory elements in eukaryotic genomes
19 April 2021
Long regulatory elements (LREs), such as CpG islands, polydA:dT tracts or AU-rich elements, are thought to play key roles in gene regulation but, as opposed to conventional binding sites of transcription factors, few methods have been proposed to formally and auto- matically characterize them. The CNRS interdisciplinary team, created in October 2014 and associating IGMM (INSB), LIRMM (INS2I) and IMAG (INSMI), developed a computational approach named DExTER (Domain Exploration To Explain gene Regulation) aimed at identifying candidate LREs. This method was applied to the analysis of the genomes of P. falciparum and other eukaryotes. These analyses show that all tested genomes contain several LREs that are conserved along evolution, and that gene expression can be predicted with surprisingly high accuracy on the basis of these long regions only. Regulation by LREs exhibits however very different behaviours depending on species and conditions.
Menichelli C., Guitard V., Martins R.F., Lèbre S., Lopez-Rubio JJ.*, Lecellier CH*, Bréhélin L.*. Identification of long regulatory elements in the genome of Plasmodium falciparum and other eukaryotes. PLoS Comput Biol. April 16, 2021
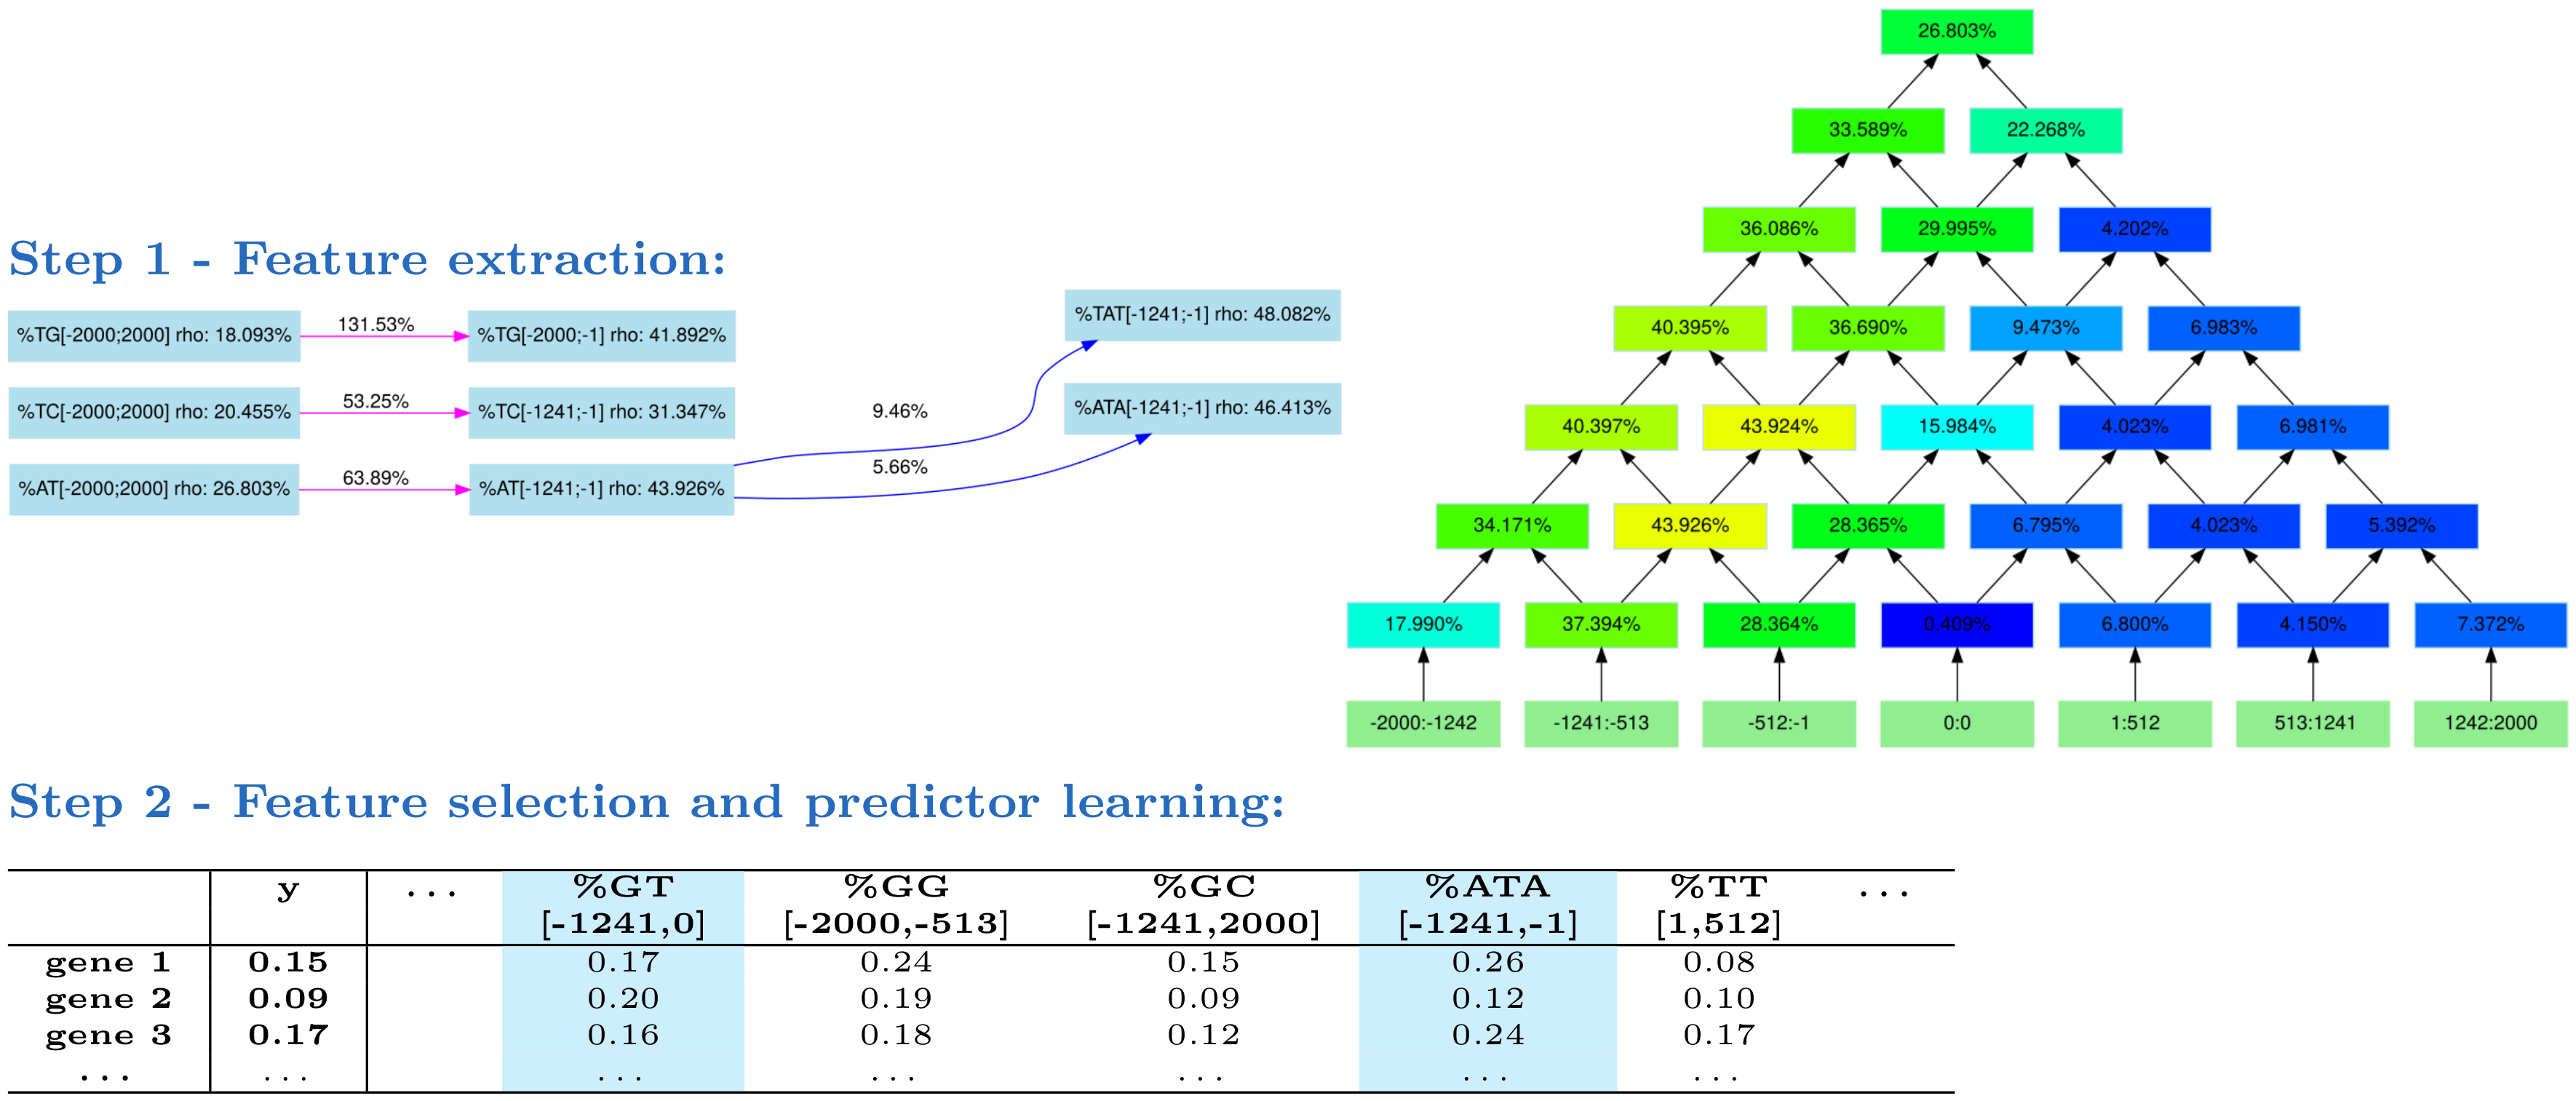
Fig 1. The DExTER method. In step 1, DExTER attempts to identify pairs of (k-mer,region) for which the frequency of the k-mer in the defined region is correlated with gene expression. DExTER starts with a 2-mer and compute a lattice (right) representing different regions. The top of the lattice represents the whole sequence, while lower nodes represent smaller regions. At each position, the correlation between 2-mer frequency and gene expression is computed, and regions with highest correlation are identified. For example, in the depicted lattice (which is the lattice associated with k-mer AT) the correlation between gene expression and AT frequency in region [-1241,-1] is 43.926%, while the correlation between expression and the AT frequency in region [513, 1241] is only 4.150%. Then, the 2-mer is extended to 3-mers, and the correlation with expression are computed in the best regions. If the correlation increases, the whole process is repeated with increasing k-mers. Otherwise, DExTER starts a new exploration from a different 2-mer, until every 2-mer has been explored. This way, different variables (i.e. pairs of (k-mers-regions)) are iteratively built (see an extract of the exploration graph on the left). In step 2, the frequency of all variables identified in step 1 are gathered into one long table. Then, a linear model predicting gene expression from a linear combination of the variables is learned. A special penalty function (LASSO) is used during training, for selecting only the best variables in the model (blue columns). If several gene expression data are available for one species (i.e. several y vectors), then step 1 is ran independently on each data, and all identified variables are gathered into a single table. Then, a linear model is learned for each data, but the different models are learned simultaneously with another penalty function that tends to select the same variables for the different data (group LASSO for multitask learning, see Materials and methods).
We use cookies to guarantee you the best possible experience on our website. If you continue to use this site, we will assume that you are happy with it.